Tools for data analysis
Using tools to take your data from unruly to structures will normally take 70-80% of your time. So don’t be disheartened when you feel like you’ve been staring at the same spreadsheet error for far too long. Think about it like a delicious meal…
- How long does it take to grow all the ingredients for your perfect meal?
- How long did all the ingredients travel along the supply chain?
- How long did it take to prepare the meal?
…and then how long did it take you to eat it?
Analysis is the same, when you’re looking at the data, you’re growing the right ingredients, putting them in the right place and preparing them so you have prepared everything to do the analysis effectively and enjoyably. Now that I’ve taken that analogy too far, let’s look at the tools you’ll need. I’ve placed the tools along the DMLE spectrum to help add some context on what you should be thinking about learning and when you should think about learning it.
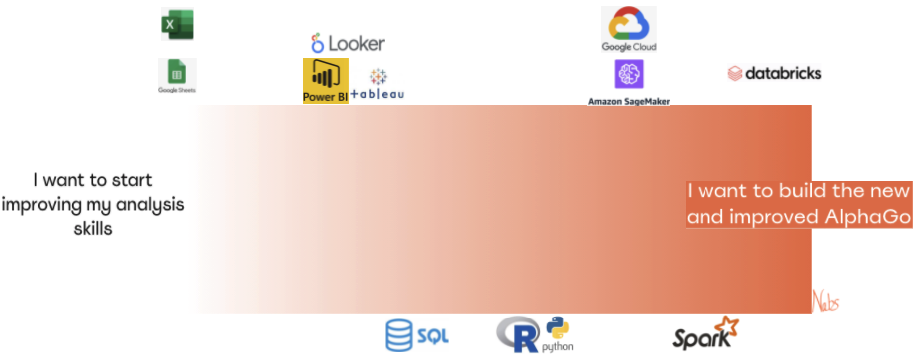
There is an abundance of tools and I’ve only captured some of the bigger names. The idea is that if you learn one of the tools within the sub-category, learning the other tools is easier.
I’m going to try and point you to the best resources I’ve found to help you with these skills. With the growth of MOOCs and Online Learning there are a few high quality and mostly free resources to learn these tools. I’ve called out some of my favourites for each below:
Spreadsheets
When it comes to spreadsheets, I am a big fan of Google Sheets. It’s free, easy to use and in my opinion has a better user experience than Microsoft Excel. However, Excel is the more powerful option so if you’re working with a really large dataset (over roughly 200,000 rows) then I would suggest excel (if you aren’t interested in python).
Courses
- There are not a lot of training materials on Google sheets at the moment, the most comprehensive and free is LearnIt’s Youtube lessons. My suggestion would be to find a random dataset and sit down in front of these videos and work on your dataset as you watch the course. The best way to learn is by doing!
- If you want a guided course on Excel, Useful Excel for Beginners on Udemy is a great quick intro to Excel. It will go over the key topics you need to learn and is free.
Data Visualisation
I don’t have a preference on data visualisation tools. I enjoy using most of them although Tableau and PowerBI’s free offerings are particularly enticing. If your company uses a specific tool then definitely start there, otherwise cutting your teeth on either Tableau or PowerBI will give you the basic understanding to then pick up most other data viz tools. Again I would recommend picking a random dataset and playing around as you learn!
Courses
- Udacity’s free Tableau course is a really well put together course which will run you through all the details on how to use Tableau.
- I think Microsoft’s own PowerBI training portal is quite well done and would recommend starting there.
SQL
Courses
- Udacity’s SQL for Data Analysis is my favourite and I would strongly recommend running through all four weeks of the course if SQL is your next challenge.
Python
If you’ve arrived at this stage of the blog, you should first be deciding between python and R. Back in the day when I had to make the same decision, I chose python. Why? In short, python has a less steep learning curve at the beginning and it was easier for me to get my hands dirty quickly. I also believe python is more prevalent across most organisations and tooling systems, which also made it an easier choice for me.
Courses
- If you’re going down the python path, the most important library to wrap your head around first is pandas. Udacity’s Data Analysis with Python does an awesome job of helping beginners get started.